Today is the first day of Women’s History Month.
Coincidentally there’s a paper making the rounds titled “The gender gap in adolescent mental health: A cross-national investigation of 566,829 adolescents across 73 countries” (Campbell et al., 2021), which makes some these interesting claims:
- Girls have worse average mental health than boys across 4 mental health measures.
- There is significant heterogeneity in the mental health gender gap size across countries.
- The gap is most pronounced for psychological distress and life satisfaction.
- More gender-equal countries have more gender gaps in mental health.
The last point, in particular, is a bit of an eyebrow-raiser. So let’s have a closer look.
The study uses the PISA 2018 dataset, introducing a couple of caveats. Namely:
- All survey respondents were 15 years old; thus, the dataset doesn’t consider higher education and employment effects.
- The data is from 2018; thus excludes the effects of the pandemic. It would be interesting to see how the responses change now that people are coming out of a lengthy lock down.
- Gender was binary. There was no non-binary option.
The study (Campbell et al., 2021) derives five measures of mental health based on the PISA 2018 dataset as follows:
-
“Life satisfaction” measures responses to the question “on a scale of 0-10, overall, how satisfied are you with your life as a whole these days?”
-
“Psychological distress” measures responses to the question on how often they felt “sad”, “miserable”, “scared”, and “afraid” on a scale of “never”, “rarely”, “sometimes”, and “always”. Each response yields points ranging from 1 through 4, respectively. Summing the points for each question results in a score of 4-16.
The survey doesn’t appear to have clarified the difference between “sad”/“miserable” and “scared”/“afraid”. PISA 2018 mentions that:
All questions were translated into the languages of participating countries by two independent linguists and then reconciled by a third to ensure consistent meaning in all countries.
-
“Hedonia” measures the responses to the question on how often they felt “happy”, “lively”, “proud”, “joyful”, and “cheerful” on the same scale. This yields a combined scale of 5-20.
-
“Eudaemonic wellbeing” measures the degree of agreement with the below statements. The scale was “strongly disagree”, “disagree”, “agree”, and “strongly agree” with a combined score in the range 3-12:
- “My life has clear meaning or purpose”.
- “I have discovered a satisfactory meaning in life.”
- “I have a clear sense of what gives meaning to my life”.
Details of the analysis are in the companion document (PDF link).
In figure S2 of (Campbell et al., 2021) shows the distribution of life satisfaction. Again, developed nations are not doing well compared with countries like Saudi Arabia.
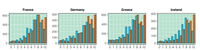
Compare with:
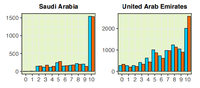
I’m skeptical that these numbers represent reality. Unless there’s a part of Saudi Arabia where adolescents are consistently happy all the time, these numbers don’t make sense. My skepticism is also extended to the data from the UAE. Human Rights Watch’s report on the UAE indicates that the UAE is far from having any semblance of gender equality. Approximately 80% of the population consists of migrant workers who’s children don’t have access to formal education. It’s unlikely that these children of migrants participated in the study.
The curve fitting for the resulting graphs is what tells the stories that are summarized at the start of this post. The axes are arranged so that moving towards the right and moving upwards indicate better conditions. Hence it’s apparent from the curves that male life satisfaction is pretty consistent and not affected all that much by GII1. Meanwhile, female life satisfaction trends downward as GII improves; hence the conclusion that more gender equality implies less happiness.
GSNI (Gender Social Norms Index) is also negatively correlated with quality-of-life measures (where we put “good” on the high end and “bad” on the low end).
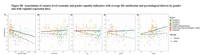
All the graphs show a high variance. Only a small number of countries are present in the study. And whether the subjects of the study are representative of the population is in doubt. Overall I find the study unconvincing.
-
GII is the Gender Inequality Index. It’s based on such factors like female and male shares of parliamentary seats, female and male population with at least secondary education, female and male labour force participation rates, maternal mortality ratio, and adolescent birth rate.arrow_upward